Google Surface
Google Search Status Dashboard
Also known as: Search Status Dashboard, Google Search Status page, Search ranking updates dashboard
The Google Search Status Dashboard is a public page run by Google that reports current and past incidents affecting Google Search systems, covering crawling, indexing and serving. When a widespread problem occurs, Google posts the affected system, a status such as service disruption or outage, timestamped updates and a resolution note. Practitioners check it to tell the difference between a Google-side fault and a problem on their own site.
What it is
It is a status page, hosted at status.search.google.com, that tracks the health of three Google Search systems: crawling, indexing and serving. Each incident entry records when the issue began, which system was affected, periodic updates from Google and when it was resolved, and past incidents stay available in a history view. It sits alongside Google's separate list of confirmed ranking updates, which records core updates, spam updates and similar rollouts with their start and end dates.
Why it matters
When traffic, impressions or indexing counts drop, the first question is whether the cause is your site, your CMS, your CDN or Google itself. A confirmed incident on the dashboard turns hours of guesswork into a documented external cause you can share with clients and stakeholders. It also stops teams from making panicked changes to a site that was never broken, which can create real problems that outlast the incident.
How it works
Practitioners open the dashboard whenever Search Console shows unexplained crawl errors, indexing drops or reporting gaps, and cross-check the incident window against their own analytics and log timestamps. Many teams add the dashboard to an incident checklist or monitor its RSS feed so alerts reach the same channel as uptime monitoring. Because entries are published only when Google judges an issue to be widespread and can appear after the fact, teams usually keep watching the history view for a few days before writing a post-mortem.
When it applies
Use it during any sudden, unexplained change in crawling, indexing or Search Console reporting, and as a standard step before escalating an issue internally or to a client. It is also worth checking when several unrelated sites you manage show the same symptoms at the same time.
Examples
- Indexing of new product pages stalls for two days; the dashboard shows an indexing service disruption covering the same window, so the team waits rather than resubmitting sitemaps.
- An agency sends a client a short note linking to the resolved incident entry to explain a dip in Search Console impressions data.
- A publisher's on-call rota includes the dashboard RSS feed in its alerting channel, next to CDN and hosting status feeds.
How it is measured
- Time from first internal alert to confirming or ruling out a Google-side incident
- Overlap between the published incident window and your own traffic, crawl or indexing anomaly
- Number of unexplained Search Console anomalies later matched to a confirmed incident
- Count of site changes or rollbacks made during incidents that turned out to be Google-side
Insights on Google Search Status Dashboard
Related terms in Google Surface
- AI ModeGoogle's standalone AI-first search experience inside Search itself, a conversational, multi-step interface for complex queries. Different ranking and citation logic from classical SERP.
- AI OverviewsGoogle's generative answer shown at the top of the SERP for eligible queries. Sourced from the open web, cites multiple pages, and increasingly replaces the traditional snippet for informational intent. Successor to the SGE experiment.
- AndroidAndroid is Google's mobile operating system, used on phones, tablets, televisions and other devices from many manufacturers. For marketers it is a discovery surface as well as a platform, because it ships with Chrome, the Google app, Google Play and Google's assistant features. Being visible on Android means being findable through those entry points, not only through a browser.
- Circle to SearchCircle to Search is an Android feature that lets people search whatever is on their screen by circling, highlighting or tapping it, without leaving the app they are in. It sends the selected content, image or text, to Google as a query and shows results in an overlay. It was introduced on selected Android devices in 2024.
- DiscoverGoogle's personalised feed in the Google app and on Android. Algorithmically curated, no query needed, driven by topical interest signals and freshness. Material traffic source for publishers.
- Google Business ProfileGoogle Business Profile is the free Google tool that lets a business manage how it appears in Google Search, Google Maps and local results. It holds core details such as name, address, phone number, opening hours, categories, photos, products, services and reviews. Formerly called Google My Business, it is the main control panel for a business's local presence on Google.
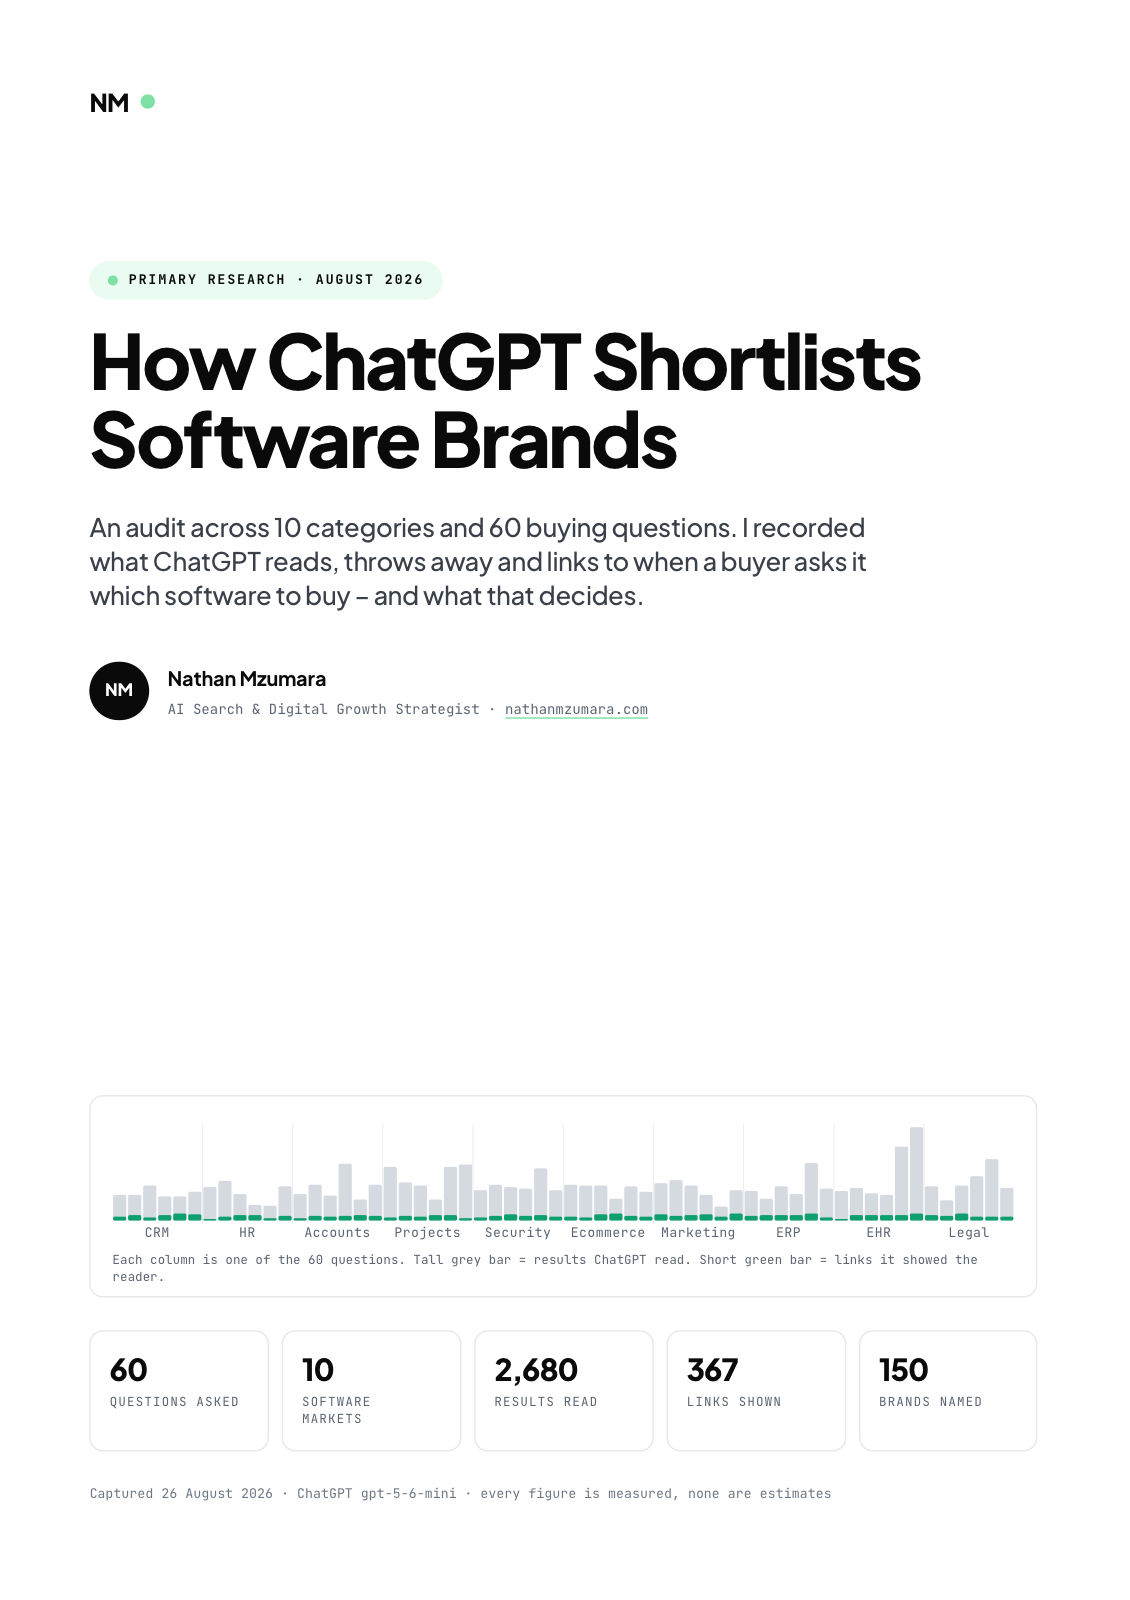
Primary research · August 2026
How ChatGPT Shortlists Software Brands
An audit across 10 categories and 60 buying questions. I recorded what ChatGPT reads, throws away and links to when a buyer asks it which software to buy, and what that decides.
- 60
- Questions asked
- 10
- Software markets
- 2,680
- Results read
- 367
- Links shown
Free download
Get the full report
35 pages · PDF · 536 KB. Enter your details and it downloads straight away.