Analytics & Measurement
Marketing Mix Modelling
Also known as: MMM, media mix modelling, marketing mix model
Marketing mix modelling is a statistical approach that relates aggregate marketing activity and external factors to a business outcome such as sales, in order to estimate what each channel contributed. It uses aggregated time series data rather than individual user journeys, so it covers offline and online media in one framework. Typical outputs are channel ROI, diminishing returns curves and budget scenarios.
What it is
A mix model regresses an outcome, usually weekly sales or conversions, on media spend or exposure plus controls such as price, promotion, distribution, seasonality and competitor activity. Adstock and saturation transformations are applied to capture carryover effects and diminishing returns. The result is a decomposition of the outcome into base demand and incremental contribution by driver.
Why it matters
Click and cookie based attribution misses offline media, brand effects and long lags, and is degraded by consent limits and cross-device behaviour. Mix modelling gives marketing and finance a shared framework for allocating total budget, including channels with no click path. It is also the main tool for answering what happens if we move spend, rather than simply who was touched last.
How it works
Analysts build a clean dataset, test model specifications and transformations, validate against holdout periods and experiment results, then use the fitted response curves for scenario planning. Bayesian methods are common because they allow prior knowledge to be included and produce uncertainty ranges. Models are usually refreshed quarterly and rebuilt when data or strategy changes materially.
When it applies
It suits advertisers with two or more years of consistent history, several channels including offline, and annual or quarterly budget decisions to make. It is a poor fit for weekly campaign tuning or very small advertisers with little spend variation.
Examples
- An FMCG brand splits sales into base and incremental, then reports the share driven by TV, retail media and price promotion.
- A direct to consumer retailer uses saturation curves to find the point where extra paid social spend stops paying back.
- A bank models a ten per cent budget cut to show the expected revenue impact by channel before planning sign off.
How it is measured
- Decomposition of base versus incremental contribution
- Channel ROI and marginal ROI with uncertainty ranges
- Out of sample forecast accuracy on a holdout period
- Consistency between model estimates and incrementality test results
Insights on Marketing Mix Modelling
Related terms in Analytics & Measurement
- A/B testingA/B testing is a controlled experiment that shows two or more versions of a page, email or feature to randomly split groups of users and compares how each performs against a chosen goal. It isolates the effect of a single change so improvement can be attributed rather than assumed. It is also called split testing.
- AI cost per taskAI cost per task is the total cost of completing one unit of useful work with an AI system, divided by the number of tasks completed to an acceptable standard. It includes model tokens, tool and retrieval calls, retries, and any human review needed before the output can be used. It is the unit economics measure behind an AI workflow.
- AttributionAttribution is the practice of assigning credit for a conversion to the marketing touchpoints that preceded it. It covers the models, rules and data joins used to decide which channels, campaigns or content get counted. In AI search, attribution is harder because many assistant-led journeys leave little or no referral data.
- Click-through rateClick-through rate is the proportion of people who saw something and then clicked it, expressed as clicks divided by impressions. It is used to judge search listings, ads, emails and internal links. A higher rate usually means the message matched what the audience was looking for.
- Consent ModeConsent Mode is a Google framework that lets tags adjust their behaviour based on the consent choices a visitor has made. Instead of tags being blocked outright, they receive signals about whether analytics and advertising storage are allowed, and act accordingly. Version 2 added parameters covering the use of personal data for ads and for ad personalisation.
- Conversion trackingConversion tracking is the practice of recording the actions you care about, such as purchases, form submissions or calls, and connecting them back to the channel, campaign or session that led to them. It gives advertising platforms and analytics tools the outcome data they need to report performance and optimise bidding. Accuracy depends on correct tag implementation, consent handling and clear conversion definitions.
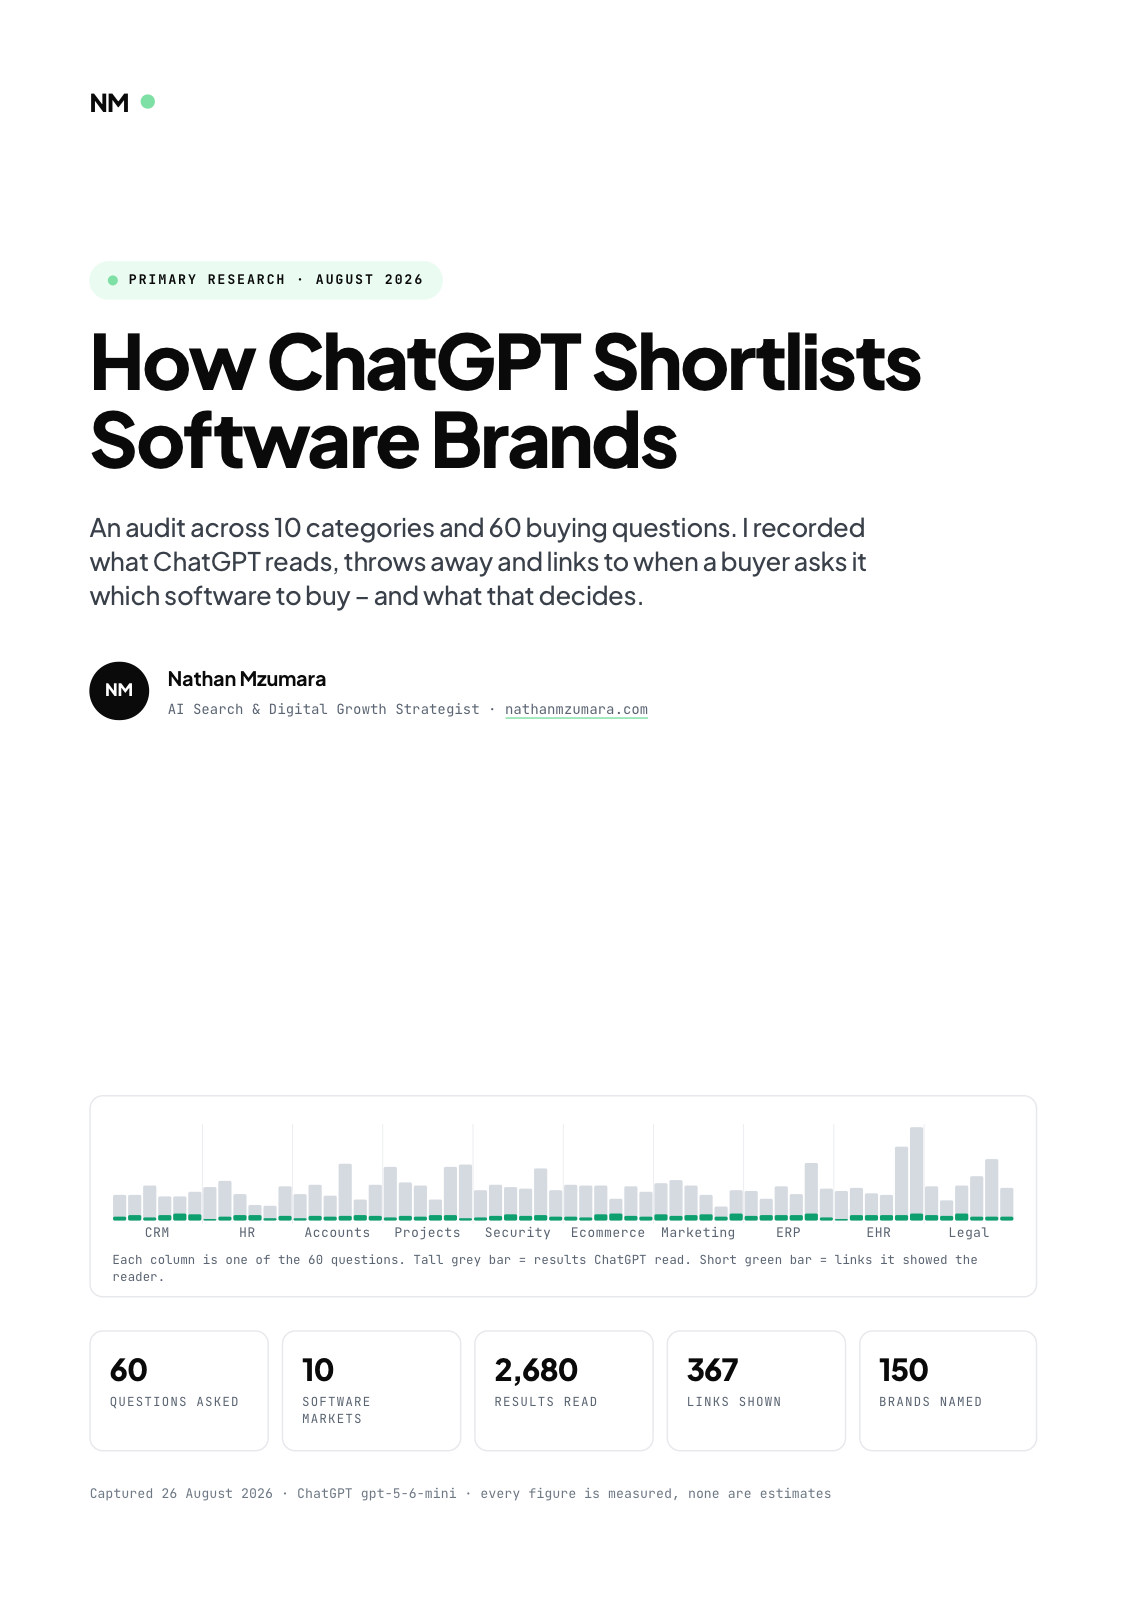
Primary research · August 2026
How ChatGPT Shortlists Software Brands
An audit across 10 categories and 60 buying questions. I recorded what ChatGPT reads, throws away and links to when a buyer asks it which software to buy, and what that decides.
- 60
- Questions asked
- 10
- Software markets
- 2,680
- Results read
- 367
- Links shown
Free download
Get the full report
35 pages · PDF · 536 KB. Enter your details and it downloads straight away.