Analytics & Measurement
Natural language querying
Also known as: NLQ, natural language query, ask-your-data
Natural language querying, or NLQ, lets people ask questions of a dataset in plain language instead of writing SQL or building a report by hand. The system interprets the question, maps it to fields and filters in the underlying data model, and returns a figure, table or chart. It is the mechanism behind ask-your-data features in analytics and business intelligence tools.
What it is
NLQ is an interface layer over a structured data source, typically a data warehouse, analytics platform or semantic model. A question such as "which channels drove the most sign-ups last quarter" is translated into a query against defined dimensions and measures, then rendered as a result. Modern implementations use large language models for interpretation but still rely on a governed data model for accuracy.
Why it matters
It shortens the distance between a business question and an answer, so marketers and founders can investigate performance without waiting for an analyst. That speed changes how often teams check data and how quickly they act on it. The same technology also raises the risk of confidently wrong answers, which is why governance of metric definitions matters more once NLQ is in use.
How it works
Teams prepare a semantic layer that defines metrics, dimensions, joins and synonyms so the model interprets business language consistently, then expose NLQ to users in a dashboard, chat interface or spreadsheet add-in. Practitioners typically review the generated query or the fields used, keep a library of trusted questions, and restrict access by row or column where data is sensitive. Answers that matter are spot-checked against a known report before being shared.
When it applies
It applies when a team has reasonably clean, modelled data and non-technical people who need frequent ad hoc answers rather than fixed reports.
Examples
- A marketing manager asks "organic sessions by landing page, last 28 days versus previous period" and gets a comparison table without opening a report builder.
- A founder asks an ask-your-data feature "which customer segment has the highest churn" during a board prep session.
- An analyst adds synonyms so that "revenue", "sales" and "turnover" all resolve to the same governed metric definition.
How it is measured
- Share of NLQ answers that match a verified report when spot-checked
- Weekly active users of the NLQ interface versus traditional dashboard users
- Number of ad hoc data requests routed to analysts before and after rollout
- Rate of failed or abandoned questions, and the terms that caused them
Insights on Natural language querying
Related terms in Analytics & Measurement
- A/B testingA/B testing is a controlled experiment that shows two or more versions of a page, email or feature to randomly split groups of users and compares how each performs against a chosen goal. It isolates the effect of a single change so improvement can be attributed rather than assumed. It is also called split testing.
- AttributionAttribution is the practice of assigning credit for a conversion to the marketing touchpoints that preceded it. It covers the models, rules and data joins used to decide which channels, campaigns or content get counted. In AI search, attribution is harder because many assistant-led journeys leave little or no referral data.
- Click-through rateClick-through rate is the proportion of people who saw something and then clicked it, expressed as clicks divided by impressions. It is used to judge search listings, ads, emails and internal links. A higher rate usually means the message matched what the audience was looking for.
- Consent ModeConsent Mode is a Google framework that lets tags adjust their behaviour based on the consent choices a visitor has made. Instead of tags being blocked outright, they receive signals about whether analytics and advertising storage are allowed, and act accordingly. Version 2 added parameters covering the use of personal data for ads and for ad personalisation.
- Conversion trackingConversion tracking is the practice of recording the actions you care about, such as purchases, form submissions or calls, and connecting them back to the channel, campaign or session that led to them. It gives advertising platforms and analytics tools the outcome data they need to report performance and optimise bidding. Accuracy depends on correct tag implementation, consent handling and clear conversion definitions.
- Cross-channel reportingCross-channel reporting is the practice of bringing performance data from search, social, email, paid media, AI assistants and other channels into a single view. It standardises metrics and time periods so channels can be compared fairly rather than judged in isolated platform dashboards. The aim is to show how channels work together to produce enquiries, sales and revenue.
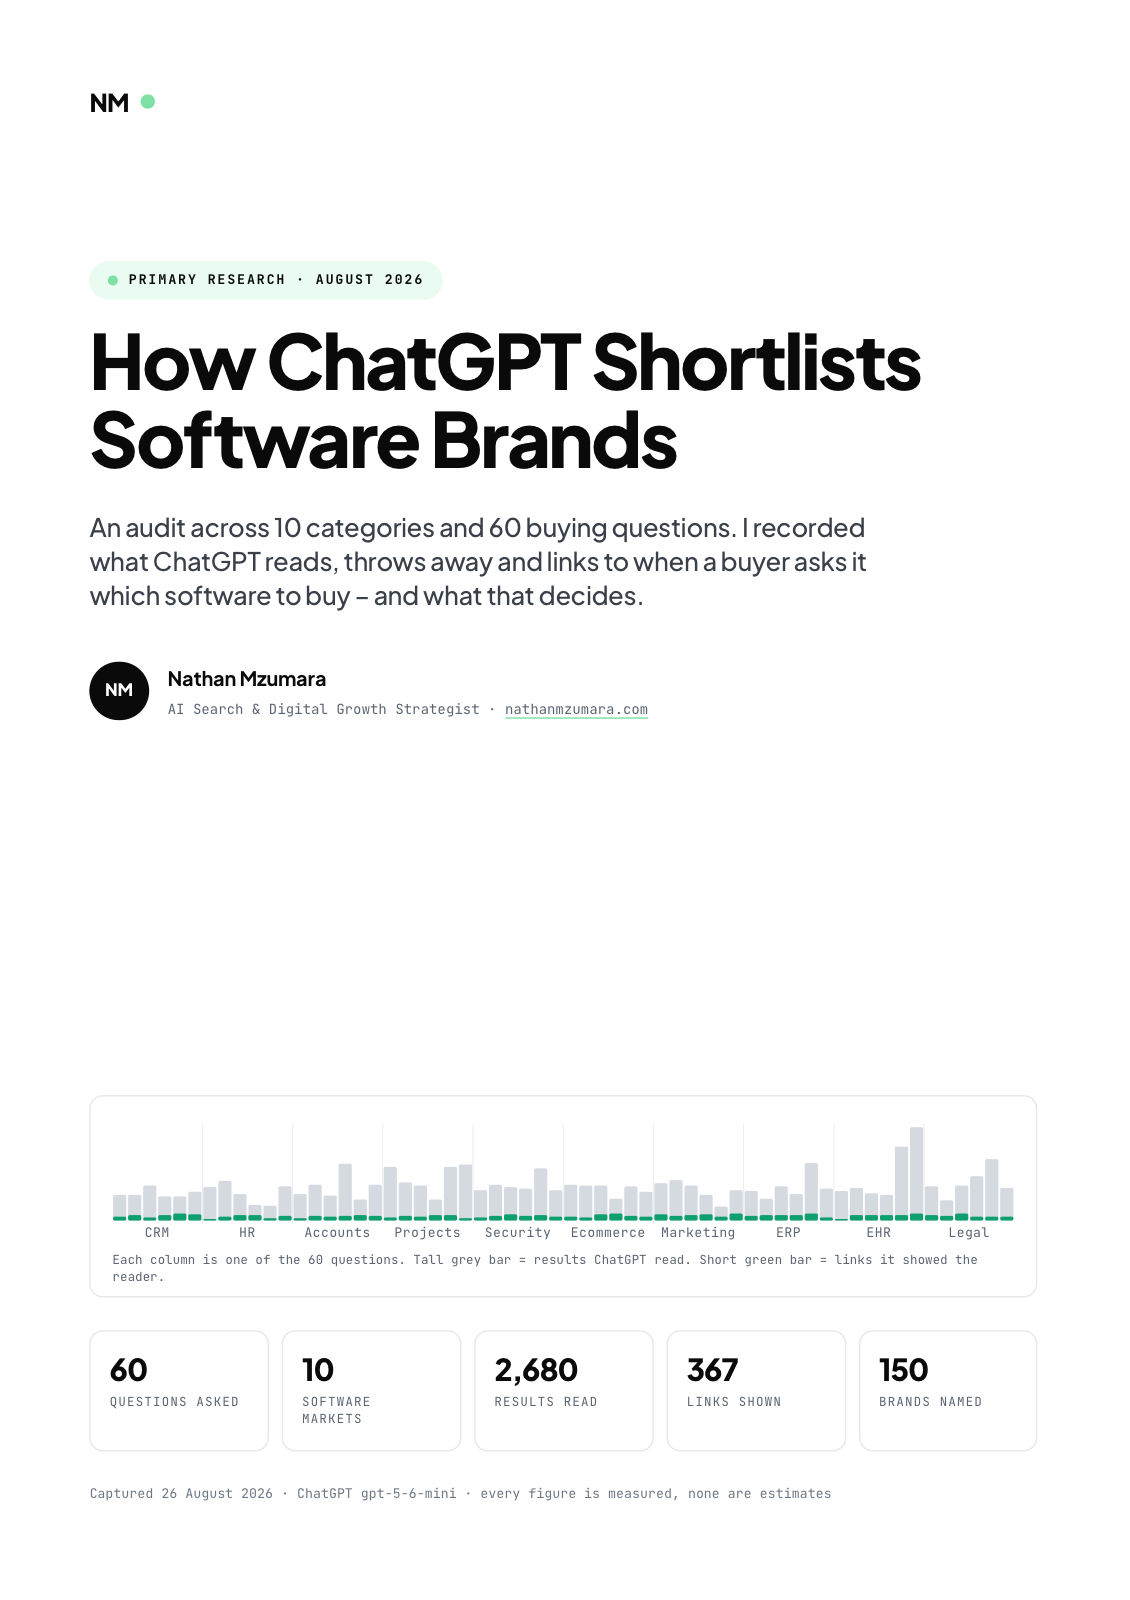
Primary research · August 2026
How ChatGPT Shortlists Software Brands
An audit across 10 categories and 60 buying questions. I recorded what ChatGPT reads, throws away and links to when a buyer asks it which software to buy, and what that decides.
- 60
- Questions asked
- 10
- Software markets
- 2,680
- Results read
- 367
- Links shown
Free download
Get the full report
35 pages · PDF · 536 KB. Enter your details and it downloads straight away.