Analytics & Measurement
Google Analytics Data API
Also known as: Data API, GA4 Data API, Analytics Data API, runReport
The Google Analytics Data API is the programmatic interface for pulling report data out of Google Analytics 4 properties. It lets you request dimensions, metrics, date ranges and filters through methods such as runReport and runRealtimeReport, returning structured data for dashboards and analysis. It replaces the older Reporting API used with Universal Analytics.
What it is
The Data API exposes GA4 reporting data over HTTP and through client libraries, with core methods for standard reports, batched reports, realtime reports and pivot reports. Requests specify a property ID, a date range, dimensions such as sessionDefaultChannelGroup or landingPagePlusQueryString, metrics such as sessions or conversions, plus filters and ordering. Responses come back as rows of dimension and metric values that you load into a warehouse, spreadsheet or BI tool.
Why it matters
Interface reporting is fine for ad hoc checks, but it does not scale to recurring analysis, blended datasets or long retention. The API lets you keep your own history, join GA4 data with Search Console, CRM or ad platform data, and build the referral and landing page reporting needed to track AI assistant and search traffic over time. It is also the practical way to automate reporting that would otherwise consume analyst hours.
How it works
Teams authenticate with a service account granted access to the property, then call runReport with the dimensions and metrics they need, handling pagination and quota limits. Scheduled jobs write results to a warehouse table so that data survives beyond the retention window in the interface and can be modelled alongside other sources. Watch for sampling, cardinality limits on high volume dimensions and the (other) row that appears when limits are exceeded.
When it applies
It applies whenever you need GA4 data outside the interface: automated dashboards, warehouse pipelines, client reporting or custom analysis. It is the standard route for anyone building repeatable measurement rather than exporting screenshots or CSVs by hand.
Examples
- A daily job calls runReport for sessions and conversions by session source and landing page, writing results to BigQuery for a blended acquisition dashboard.
- An agency pulls the same report across twenty client properties on a schedule and feeds a single Looker Studio template.
- A team filters sessions by referrer to isolate traffic from AI assistants and chat products, then tracks that segment week on week alongside organic search.
How it is measured
- Number of scheduled API pulls completing successfully versus failing
- Quota consumption against property and project limits
- Share of responses affected by sampling or (other) row aggregation
- Freshness and completeness of the warehouse tables the API feeds
Insights on Google Analytics Data API
Related terms in Analytics & Measurement
- A/B testingA/B testing is a controlled experiment that shows two or more versions of a page, email or feature to randomly split groups of users and compares how each performs against a chosen goal. It isolates the effect of a single change so improvement can be attributed rather than assumed. It is also called split testing.
- AI cost per taskAI cost per task is the total cost of completing one unit of useful work with an AI system, divided by the number of tasks completed to an acceptable standard. It includes model tokens, tool and retrieval calls, retries, and any human review needed before the output can be used. It is the unit economics measure behind an AI workflow.
- AttributionAttribution is the practice of assigning credit for a conversion to the marketing touchpoints that preceded it. It covers the models, rules and data joins used to decide which channels, campaigns or content get counted. In AI search, attribution is harder because many assistant-led journeys leave little or no referral data.
- Click-through rateClick-through rate is the proportion of people who saw something and then clicked it, expressed as clicks divided by impressions. It is used to judge search listings, ads, emails and internal links. A higher rate usually means the message matched what the audience was looking for.
- Consent ModeConsent Mode is a Google framework that lets tags adjust their behaviour based on the consent choices a visitor has made. Instead of tags being blocked outright, they receive signals about whether analytics and advertising storage are allowed, and act accordingly. Version 2 added parameters covering the use of personal data for ads and for ad personalisation.
- Conversion trackingConversion tracking is the practice of recording the actions you care about, such as purchases, form submissions or calls, and connecting them back to the channel, campaign or session that led to them. It gives advertising platforms and analytics tools the outcome data they need to report performance and optimise bidding. Accuracy depends on correct tag implementation, consent handling and clear conversion definitions.
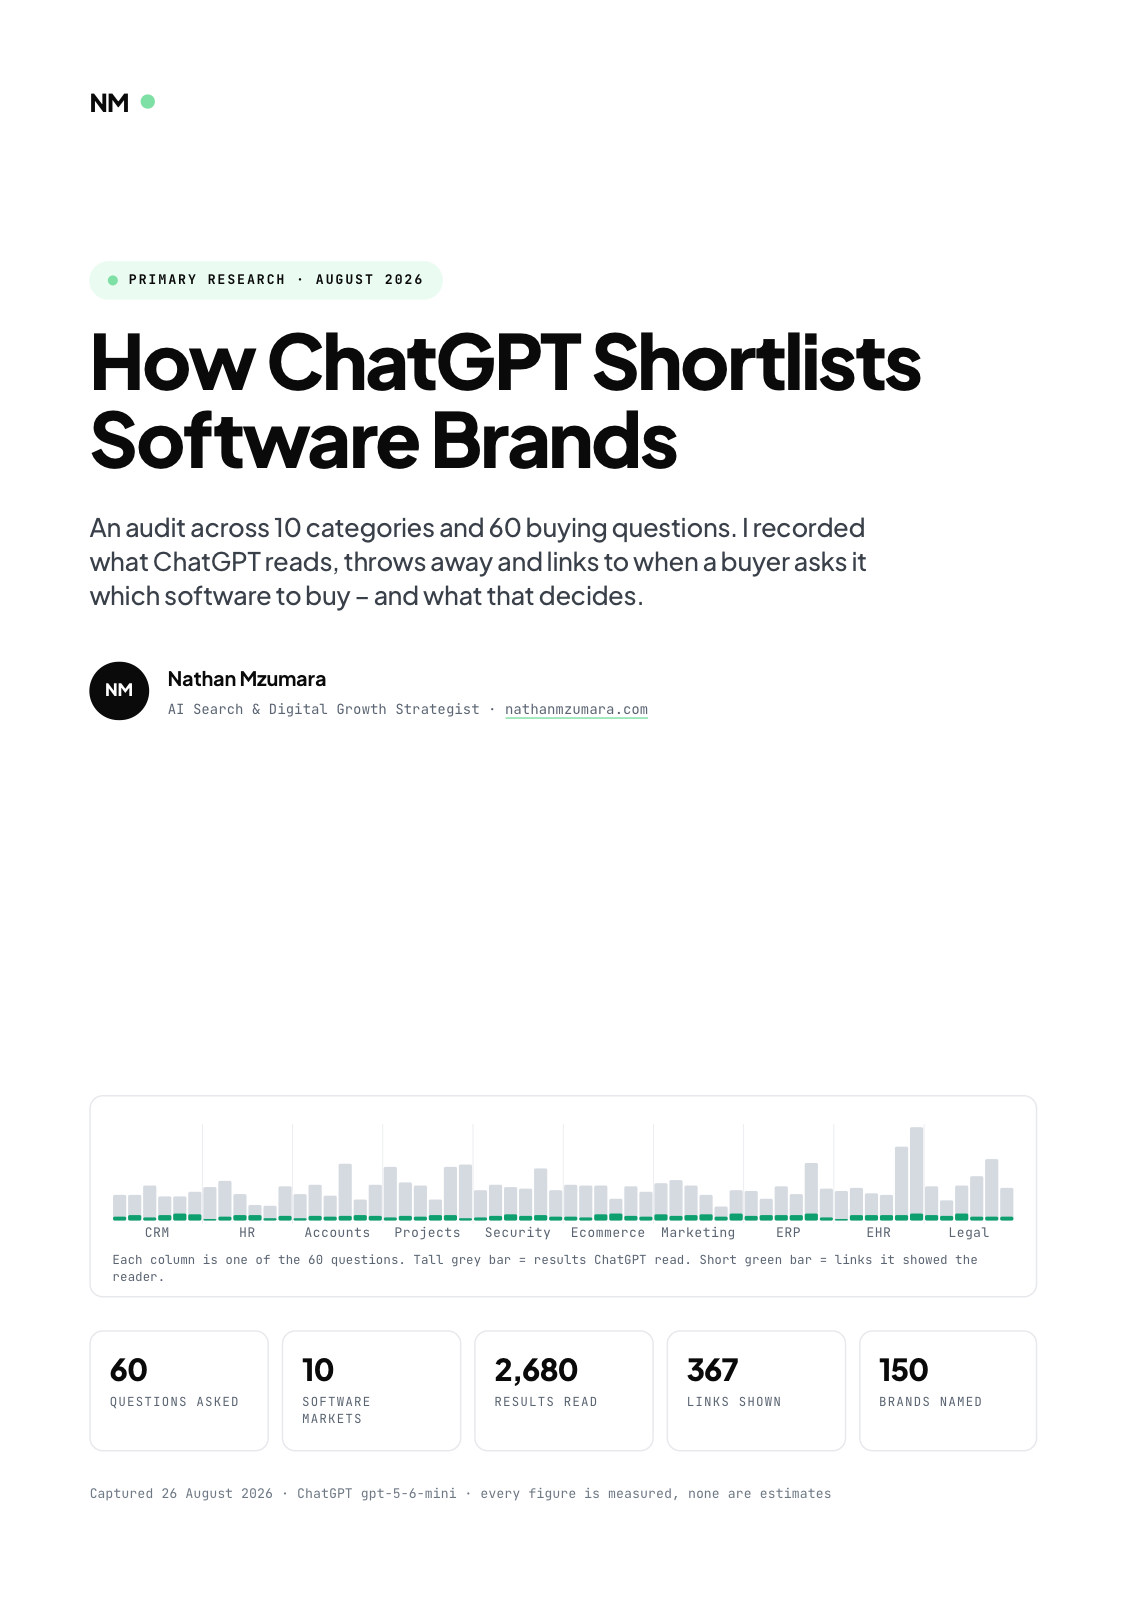
Primary research · August 2026
How ChatGPT Shortlists Software Brands
An audit across 10 categories and 60 buying questions. I recorded what ChatGPT reads, throws away and links to when a buyer asks it which software to buy, and what that decides.
- 60
- Questions asked
- 10
- Software markets
- 2,680
- Results read
- 367
- Links shown
Free download
Get the full report
35 pages · PDF · 536 KB. Enter your details and it downloads straight away.